I think they are nuts.
Here is a chart of their current forecast.

The difficulty in a general forecast for the country, of course, is that the fall in house prices across the country varies enormously. The Case-Schiller 20 data below h/t Calculated Risk (CR) shows more than a 10 to 1 variation in house price deterioration from state to state.

I like to base my forecasts on nation wide average and median data, so I tend to look at data such as the NYT updated chart below from the Ritholtz blog which shows about another 20%-30% fall in average house prices before reverting to the pre 2000 "norms"

_______________________________________________
The rest of this post will focus on more chart data backing up mybelief that housing prices will continue to fall for some time -- probably for a few years. The factors causing the continued drop in prices include:
- Excessive household and bank debt
- High and rising unemployment
- Large inventories of unsold houses
Below are a few charts presenting some of the data that I find convincing.
The first chart below is a long term macro view of housing vs income (Ritholtz.) This is a variation of the "mortgage should not be more than x times income" data looked at historically. Clearly, the ratio became badly skewed in the early 2000's.
There is usually a tendency for overshoot in all "mean reverting" phenomena, so I suspect the curve will move towards about 3.8 or so from the current ratio of about 4.4, for a further drop of about 15%-20%.

_________Data from Ned Davis Research_____
Interest rates, sales and inventory
The most recent sales and inventory data is not very encouraging: 30 year mortgage rates are at their lowest rate since pre WW2

Nevertheless, houses are not selling
Below are existing home sales (CR) -- back to 1994 levels. Sales of about 4 million units/year.

And new home sales -- at pre 1964 levels of about 300,000 units/year

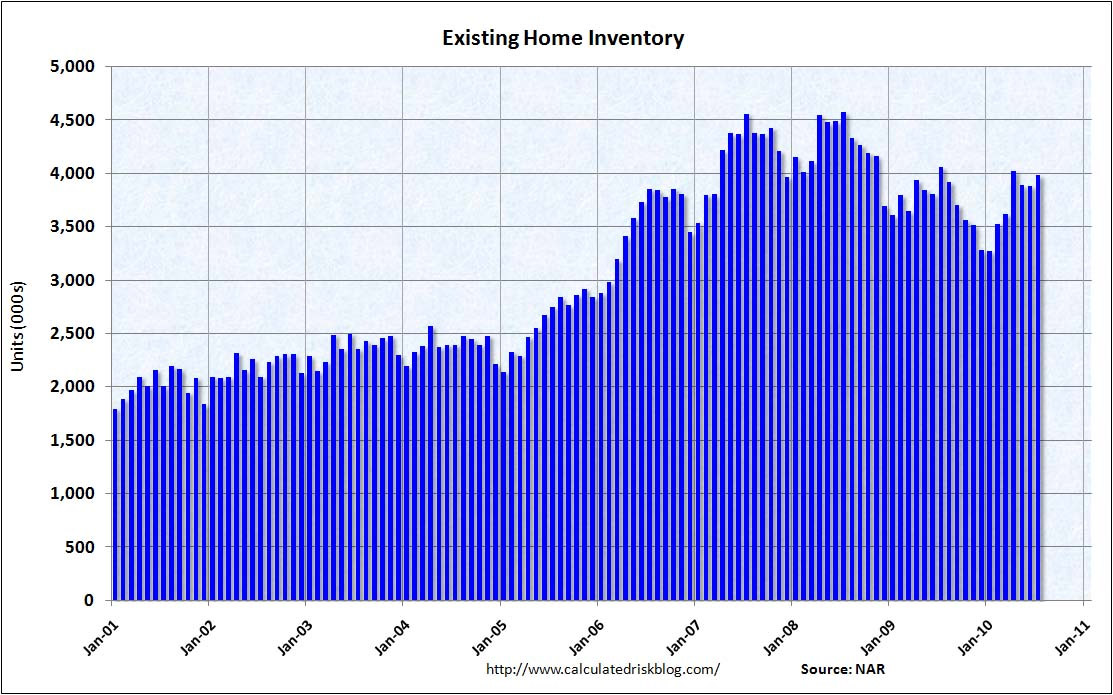
And "Months of Supply" of existing housing inventories are at near record highs

As are existing home unit inventories of about 4 million units
Building contractors are nearly an extinct species -- witness new housing starts

And they show no sign of life -- witness applications for building permits

With the sampling of data above and the delinquent mortgage data below -- (Note that 14% of mortgages is about 7 million units)

And bearing in mind that this "shadow inventory" of 14% of delinquent mortgages (approximately 7 million houses) are not yet on the market, I cannot imagine how house prices will rise unless the federal government steps in with some massive, yet to be identified program.
In summary the housing sales/inventory picture looks something like this:
- Sales rate (existing houses) about 4 million houses/year
- Current housing inventory for sale (existing houses) about 4 million houses
- "Shadow inventory" (delinquent mortgages) not yet on market in the region of 7 million houses. Most of these mortgages will default -- about 60% (4 million houses) are already more than 60 days delinquent.
- Putting it all together, there is in the region of two years worth of housing inventory across America. The "norm" is about four to six months.
No comments:
Post a Comment